
The�Pira 175 Broadcast Analyser is designed by use for Broadcast Engineers. �It can be used on FM radio signals to measure and adjust peak deviation, pilot and RDS level and phase and even carrier frequency.
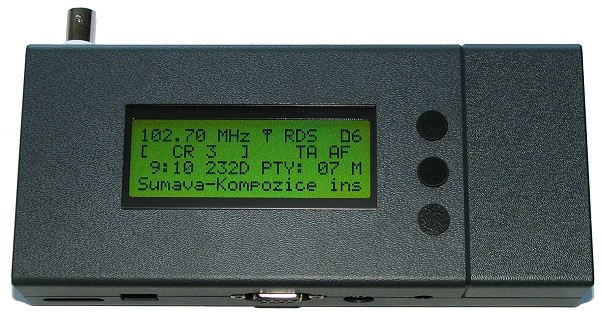
It looks a bit “home made” (indeed you can purchase just the electronics without the box), but in fact it performs very well indeed and is as accurate as much more expensive kit.
Below are some screengrabs from the “FM Scope” application that comes with the Pira 175 Broadcast Analyser device. We are displaying them at half size, so if you want a closer look, then right click and “file save as”. There is also an “FM Guard” software that lets you monitor one or more device and set alarms for various things like peak or min deviation, pilot deviation etc.
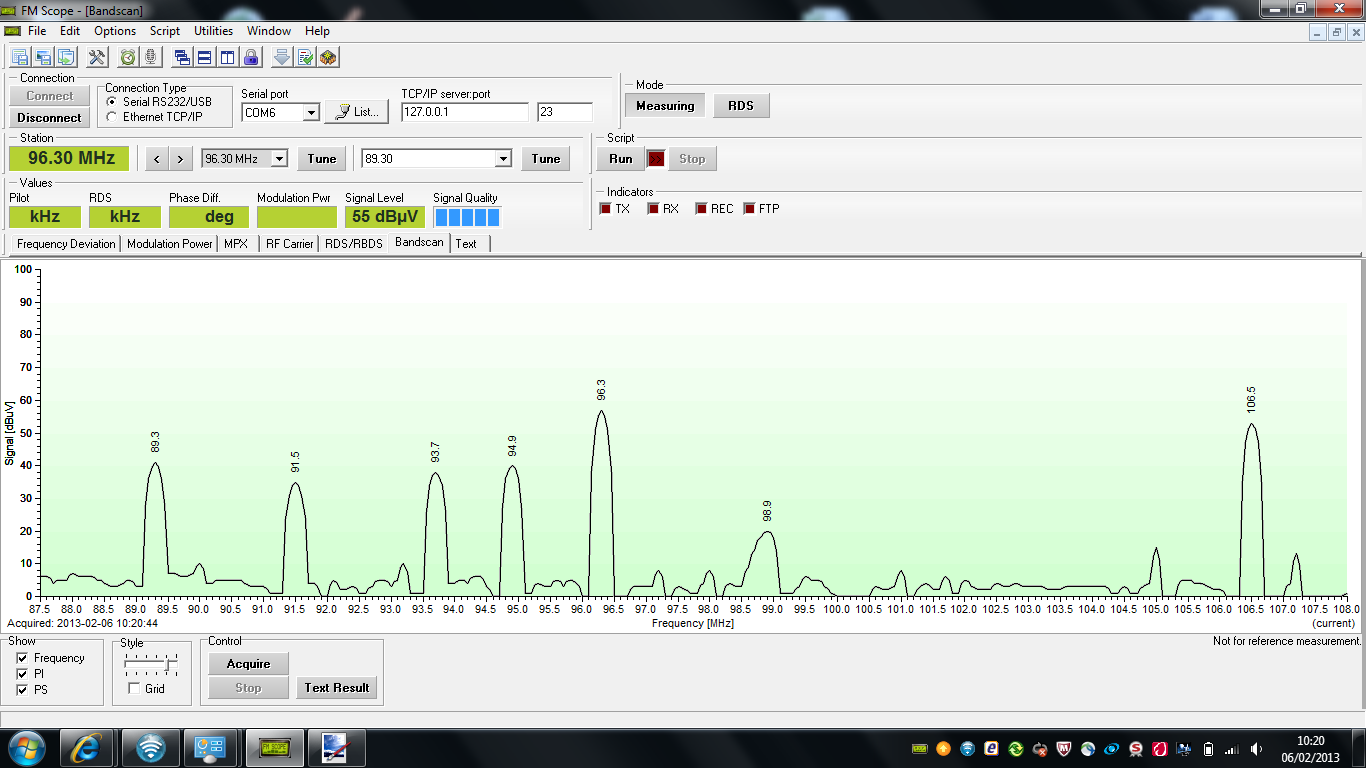
First off we have a simple bandscan. This is of limited technical value because the device is not a calibrated receiver, nor was it used with a calibrated antenna. Moreover it is relatively deaf (ie: insensitive) so it does not pick-out the weaker stations. Still interesting for an overall view of the FM environment:-
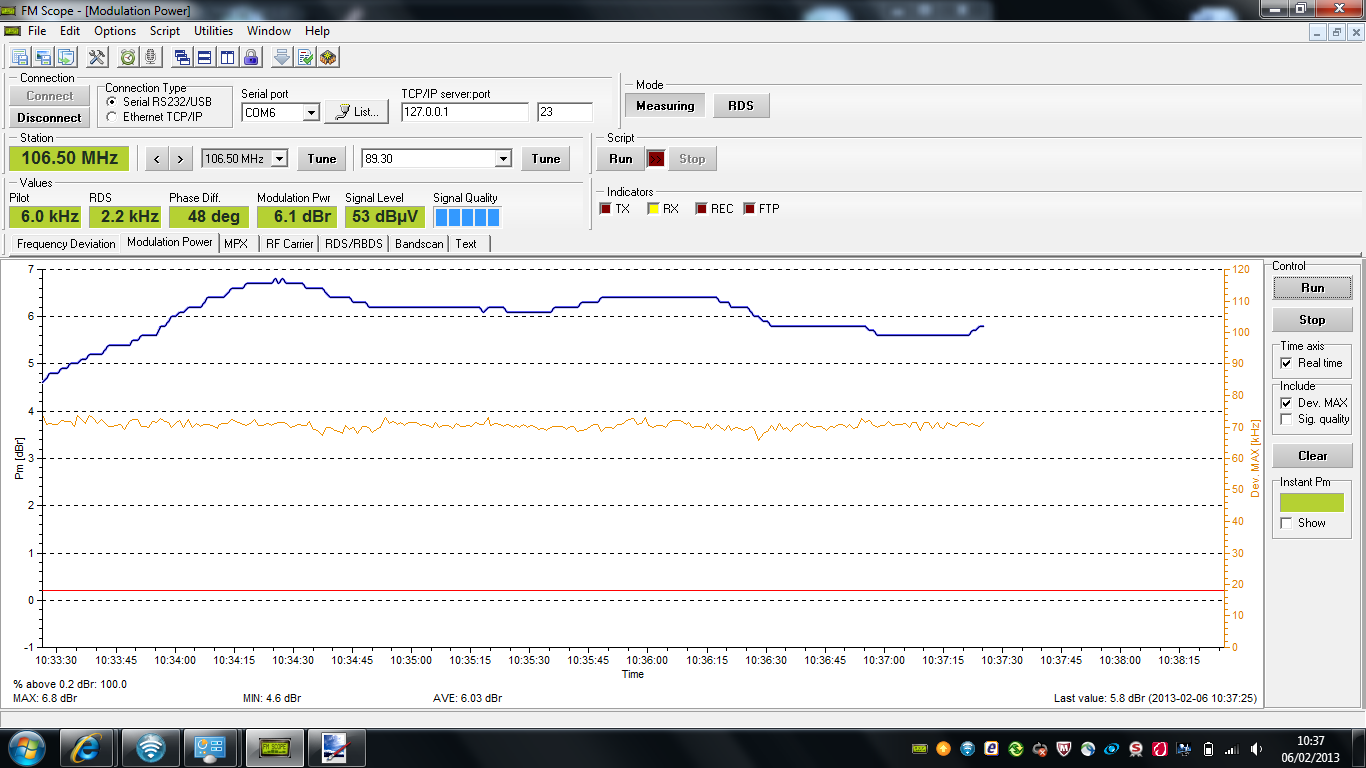
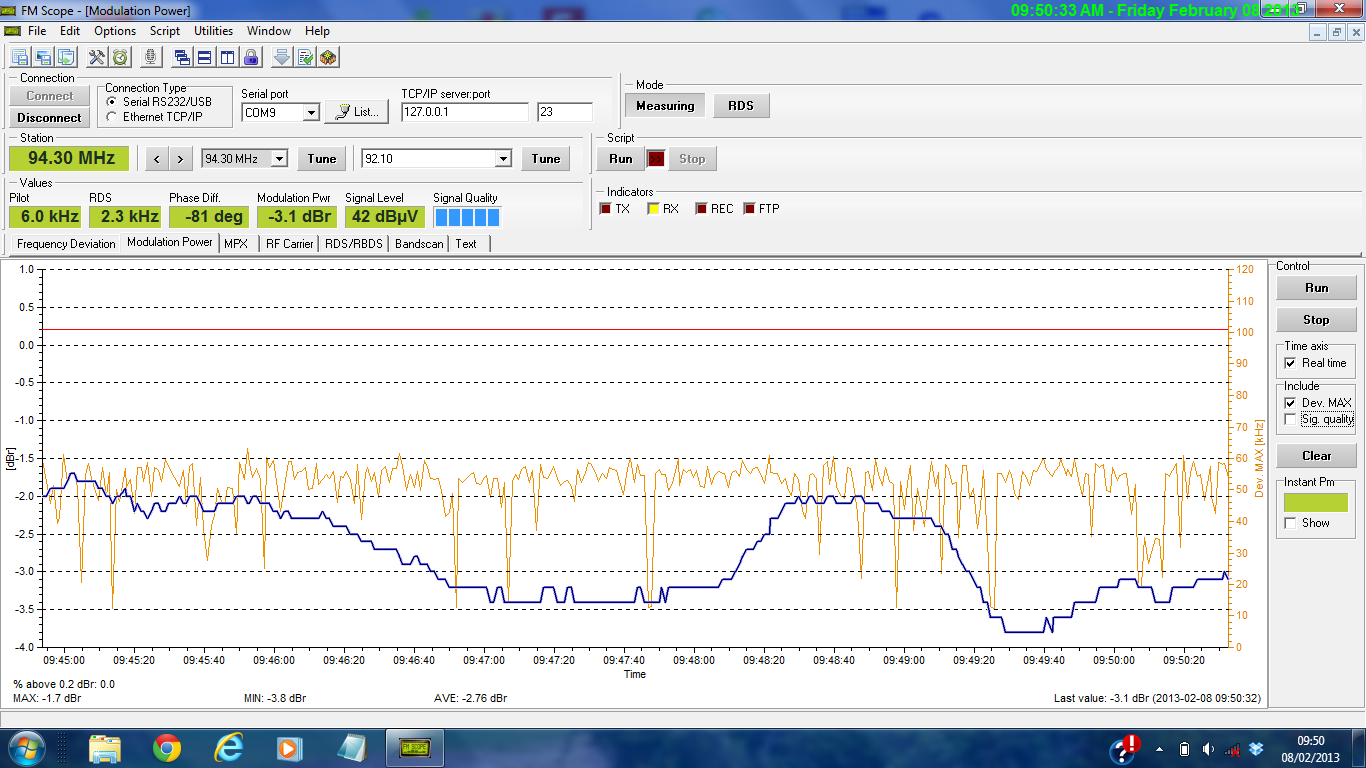
Next we have the “Modulation Power” display. Modulation power in dBr is effectively a measure of the average “loudness” of the audio and gives an indication how much audio processing is used. For example for a given piece of music, without audio processing it might average at 0dBr. The same piece of music played on a transmission system with typical aggressive audio processing might show as 5, 6 or even 8dBr. The Modulation power tends to be lower during phases of speech than during music. This chart also shows peak deviation – displaying the peak deviation seen during a measuring time of 50 ms.
First we show Jack FM which is on the loud end of the scale, then Radio 2 which is not so loud, and finally Radio 4 which, on average, is one of the quietest stations on the dial along with Radio 3.
Jack FM 106.5MHz
Radio 2 98.9MHz

Radio 4 94.3MHz
The Pira175 also has a spectral occupancy display. It’s not a spectrum analyser, and you cannot adjust its resolution bandwidth, but it is still an interesting display:-
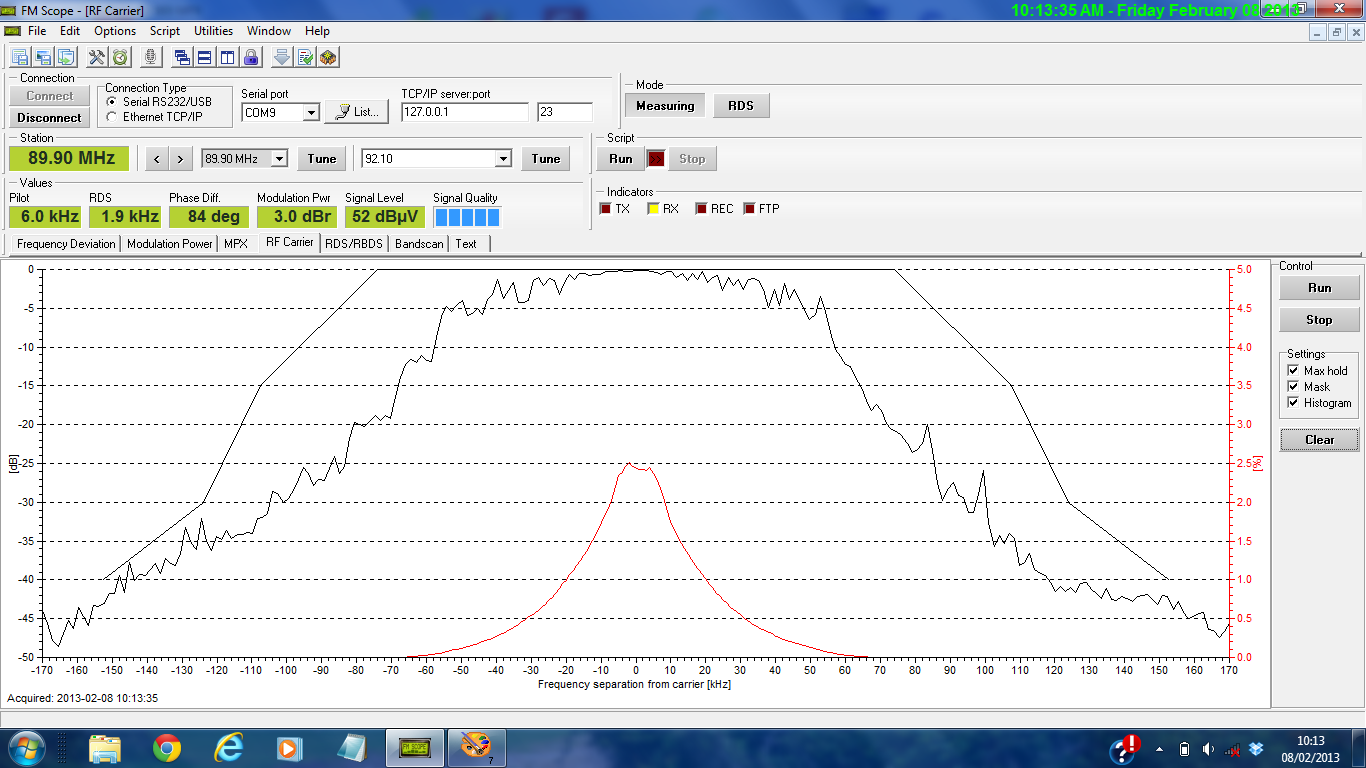
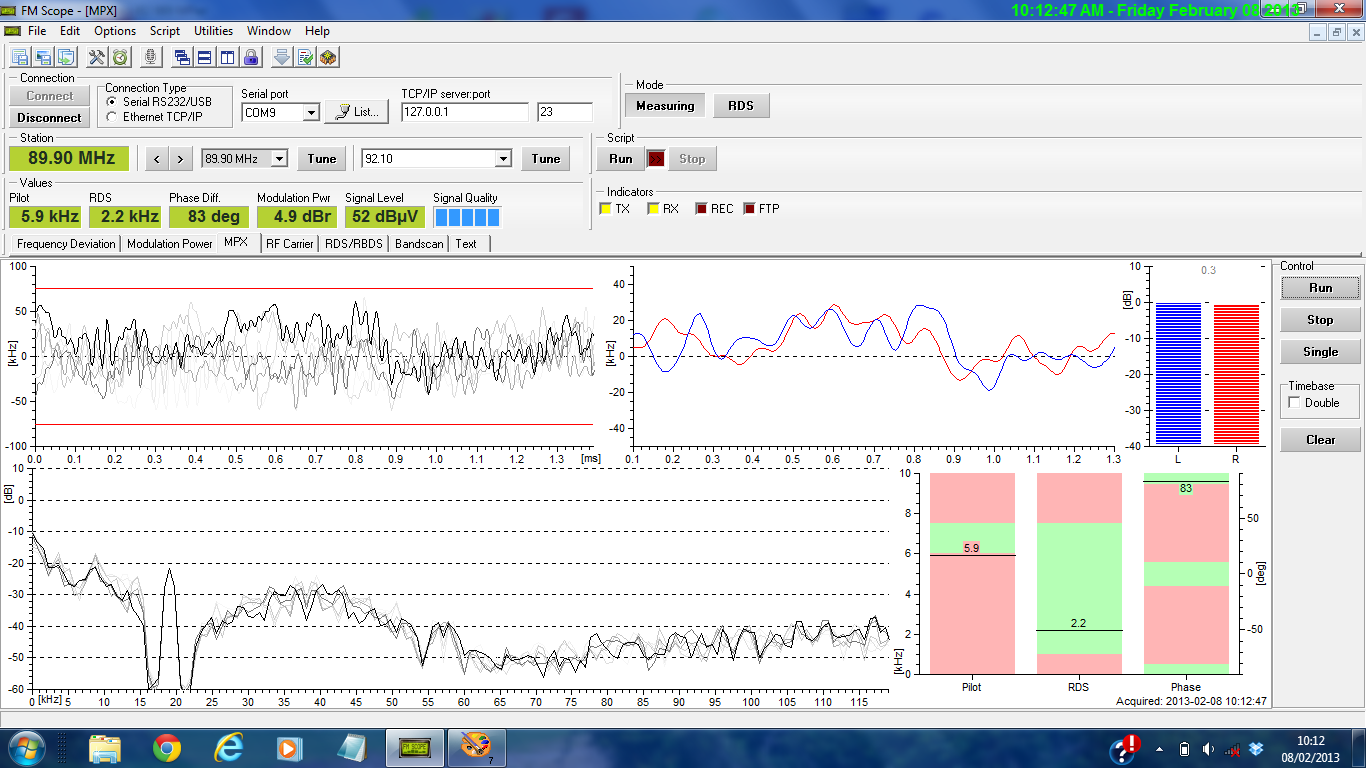
Next we have a display of the MPX signal in time and frequency domains. It is most useful for checking pilot tone and RDS subcarrier level/phase.
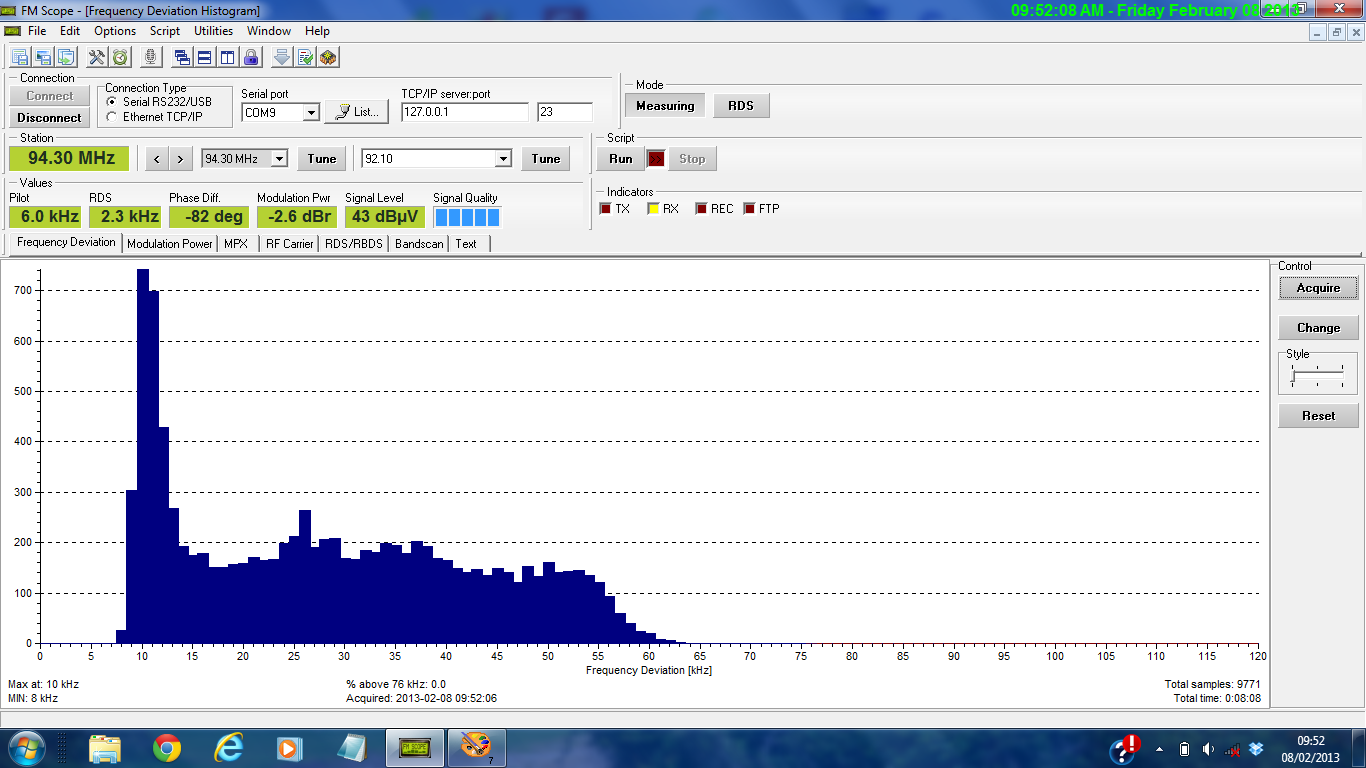
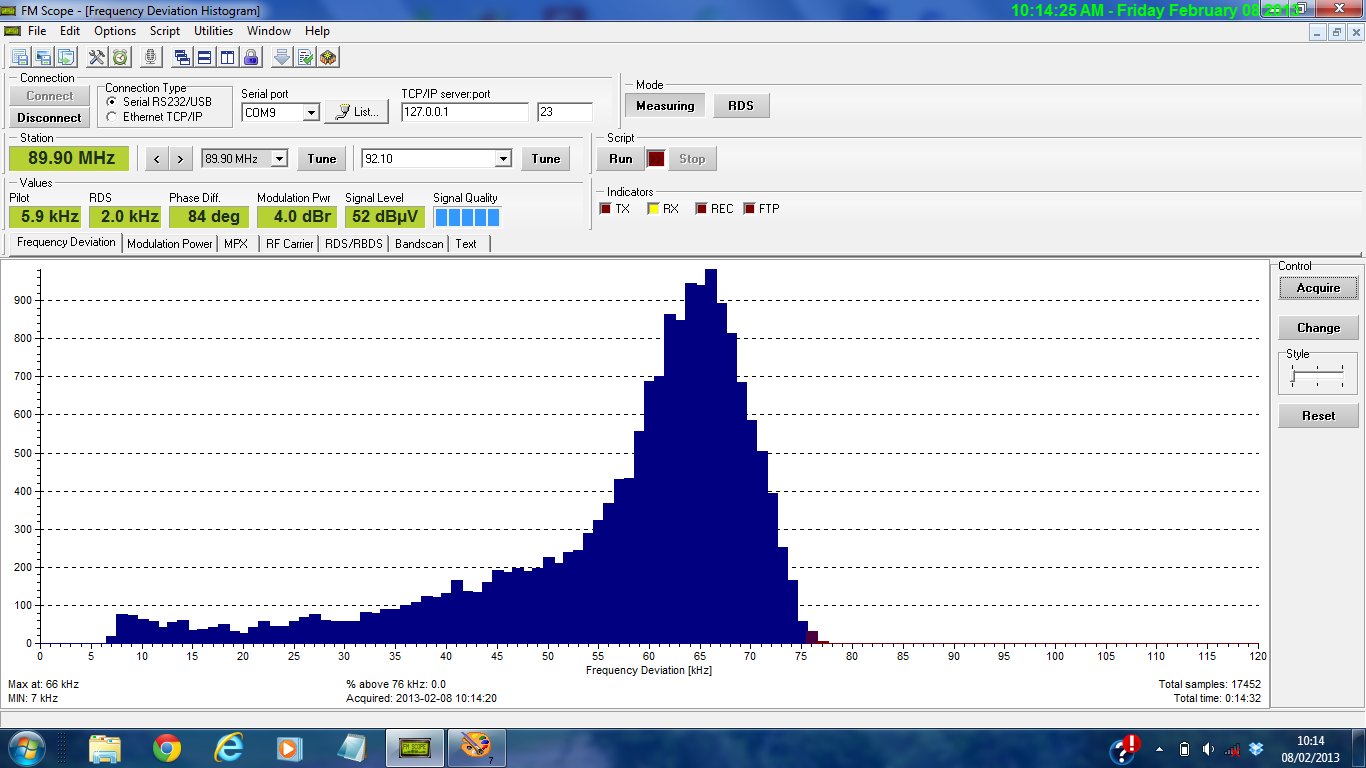
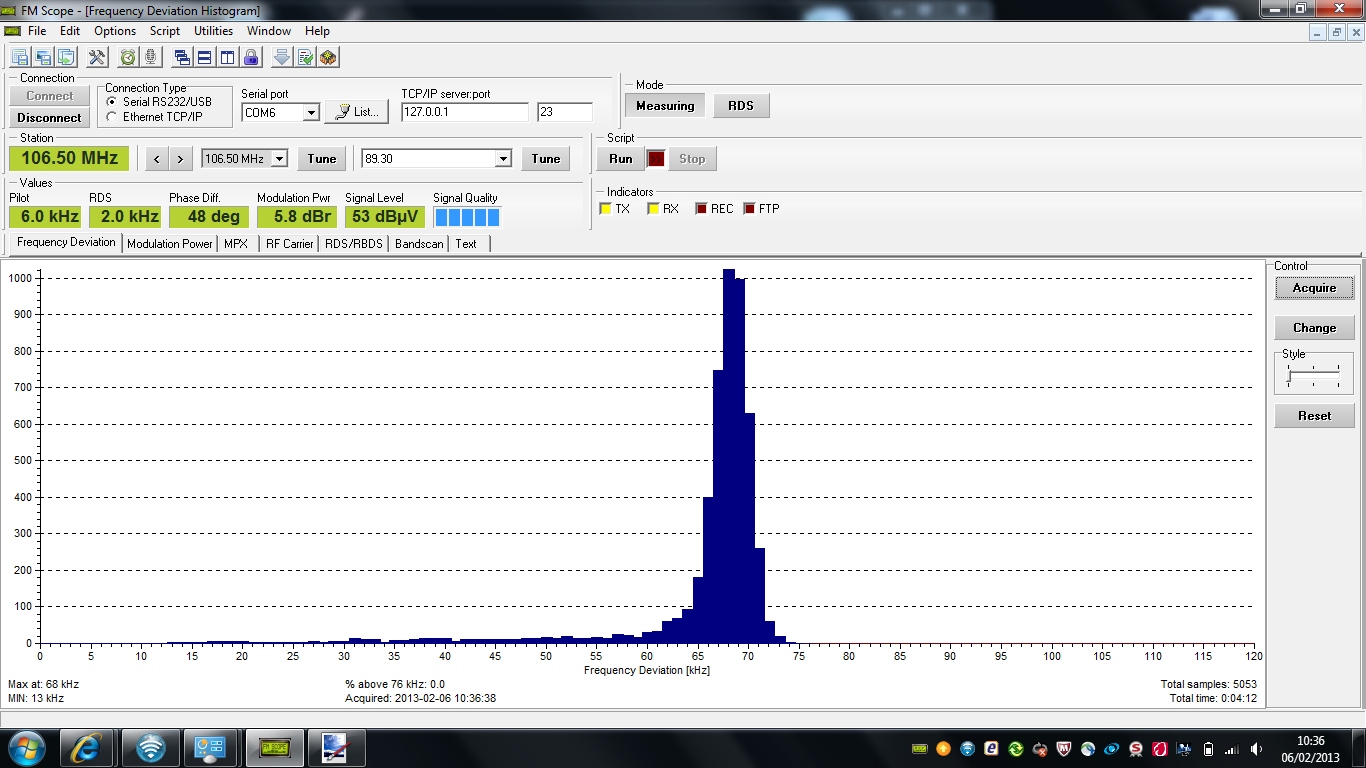
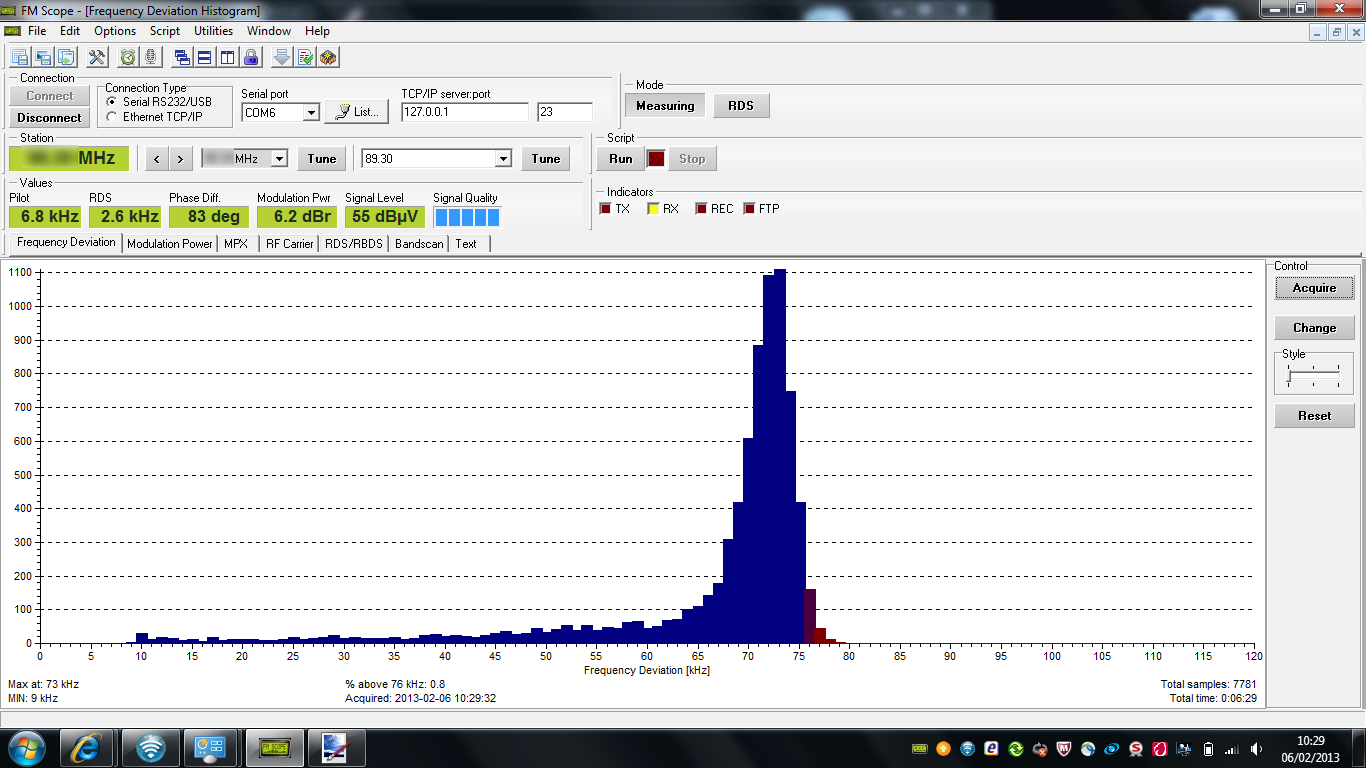
Finally some interesting plots showing PDF curves of frequency deviation. Below you see the results for several stations. You will see that deviation is never below 8 or 9 kHz – that is because even when there is no audio, you still have the 19kHz pilot and 57kHz RDS subcarrier giving some frequency modulation on the carrier. First Radio 4 which never reached peak deviation of 75kHz during the monitoring period and was noticably quieter than other stations on the dial (mainly speech with some music during measurement). Then Radio 2 which shows the impact of reasonably aggressive audio processing – all the samples are shifted to the right – more deviation = louder. After that Jack FM is louder still, with an even greater proportion of deviation focussed between 65 & 75 kHz. Finally there is “Station X” which seems to be over-deviating to some extent (actually the Radio 2 measurement had a tiny amount of over deviation too, but probably nothing to worry about and may even be measurement error). I’m waiting to see if some checks with proper calibrated equipment give the same result for “Station X”. In case you are wondering, Station X is an Ofcom licenced station. (Note – some months after this we used the P175 to commission a transmitter. �Ofcom confirmed the deviation was spot-on which is fairly rare in their experience – they normally expect to make some changes). �Thus we can say this device is as good as an Audemat device (that Ofcom use) for measuring and adjusting peak deviation.
Radio 4 94.3MHz
Radio 2 98.9MHz
Jack FM 106.5MHz
Station X
This product can be used stand-alone with a basic LCD display, or connected to a PC using the FM Scope or FM Guard software. It has many other features – most notably the ability to report carrier frequency error relative to a trusted transmission.
You can find out more about the Pira Broadcast Analyser�here. Please note that we do not supply, nor are not endorsing this product, nor do we receive any reward if you choose to purchase one.